
Finding out about the average salary in the UK is much more than just comparing yourself to other people in the company.
Of course, there is some of that – it’s perfectly natural to want to know where you sit in comparison to the ‘average’ citizen. But how much we get paid has a huge impact on the economy as a whole.
Today we are taking a look at the average wages in the UK and what the latest figures published recently can tell us, both about our personal finances and the wider implications.
We will also break down the findings to see how they differ between regions, age groups and industries – and most importantly, compare them against inflation.
What is the average weekly salary in the UK?
According to the latest statistics published in May 2024 by the Office of National Statistics, the average total pay in the UK is £682 a week. The average regular pay is £637.
The Difference Between Total Pay & Regular Pay
The average total pay refers to the total amount that workers get paid, including bonuses such as overtime. Regular pay, on the other hand, only refers to your base pay, or salary.
Is the average pay in the UK rising?
Average pay in the UK has continued to rise at a steady rate for over 20 years, with the only exception being the first few months of the COVID-19 pandemic.
The latest figures have shown that total pay has risen by 5.7% for the period January – March 2024, while regular pay has risen by 6.0% for the same period.
What does this equate to over a Month & year?
If we were to extrapolate the weekly figure over a full year, this would equate to an annual total pay of £35,464, or an average regular pay of £33,124.
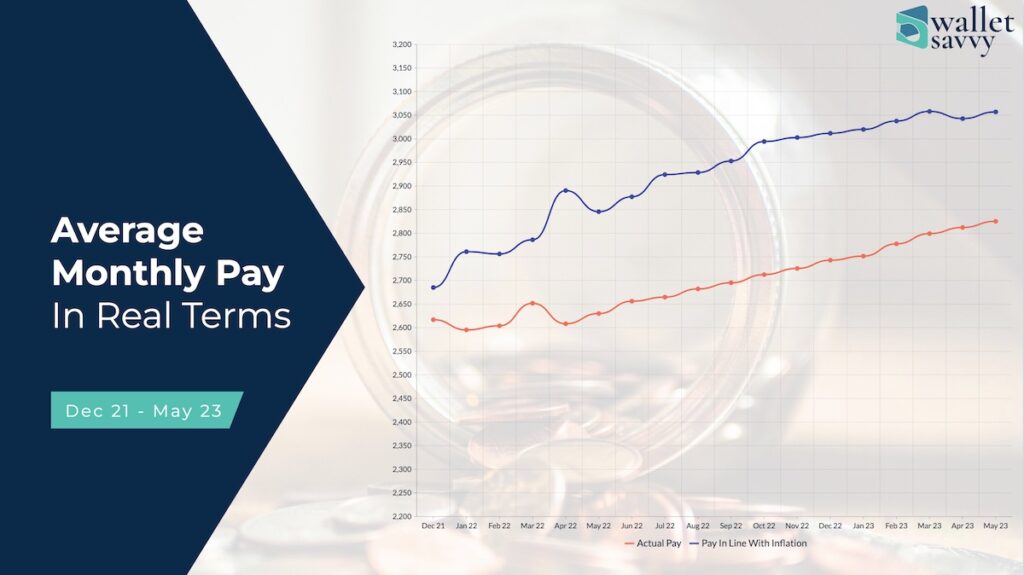
We have also taken the weekly data and converted it to a monthly figure (multiplying it by 4.34) to use in the graph below that shows the disproportionate rise in inflation compared to wages.
There are things to consider when viewing these figures though, like seasonal work in certain industries which will cause the overall figure to rise or fall as temporary workers find themselves in and out of work.
Does an increase in salary mean we are getting more wealthy?
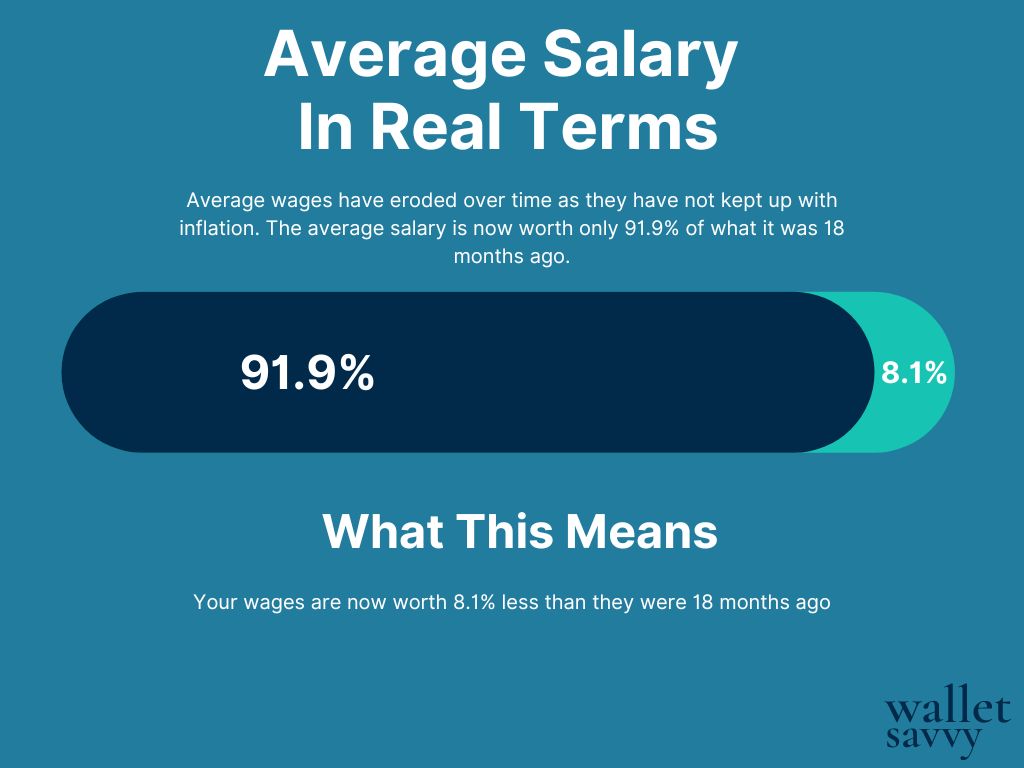
Unfortunately, an increase in the average salary does not necessarily mean that we are getting richer as a nation. What really matters in this regard is whether the average salary in the UK is keeping up with the rate of inflation in the country – as seen above.
Is the average pay in the UK keeping up with inflation?
The current rate of inflation, as monitored by the ONS, is 8.7% as of June 2023. With the rate of average total pay increasing by 6.9% this actually means that we are earning less money in real terms. We can buy less with the money we earn.
In real terms the average total pay fell by 1.2% between March – May 2023, and average regular pay fell by 0.8%. This is really the crucial figure when looking at changes to the average salary – this tells us what our earnings are truly worth, and at the moment, they are worth less than they were previously.
This will continue to be the case until the increase in average wages overtakes the increase in inflation. Even early data for June 2023 shows that this gap has still not been bridged.
What is inflation?
Put simply, inflation is the price of goods, measured over time. The ONS measures inflation by tracking the price of typical goods that households purchase, and recording how that price changes over time.
The ‘basket of goods’ that they use to monitor inflation is constantly modified to reflect spending trends – recent additions have included security cameras, e-bikes and frozen berries, while digital cameras and non-chart CDs have been removed.
How many hours do we work on average in the UK?
The average number of work hours for full-time workers in the UK is 36.7 hours. This has been roughly for a while now, it has been 36 hours or over since mid 2021 which is when the level began to stabilise following the pandemic.
Taking a longer view of it, the average number of hours that full-time workers work in a week has actually decreased slightly since the data was first collected by the ONS in 1992, when the average was 38.1 hours.
How does the average wage differ between regions?
We all know that the amount you get paid can vary significantly depending on where you live, but which areas offer the highest average salaries?
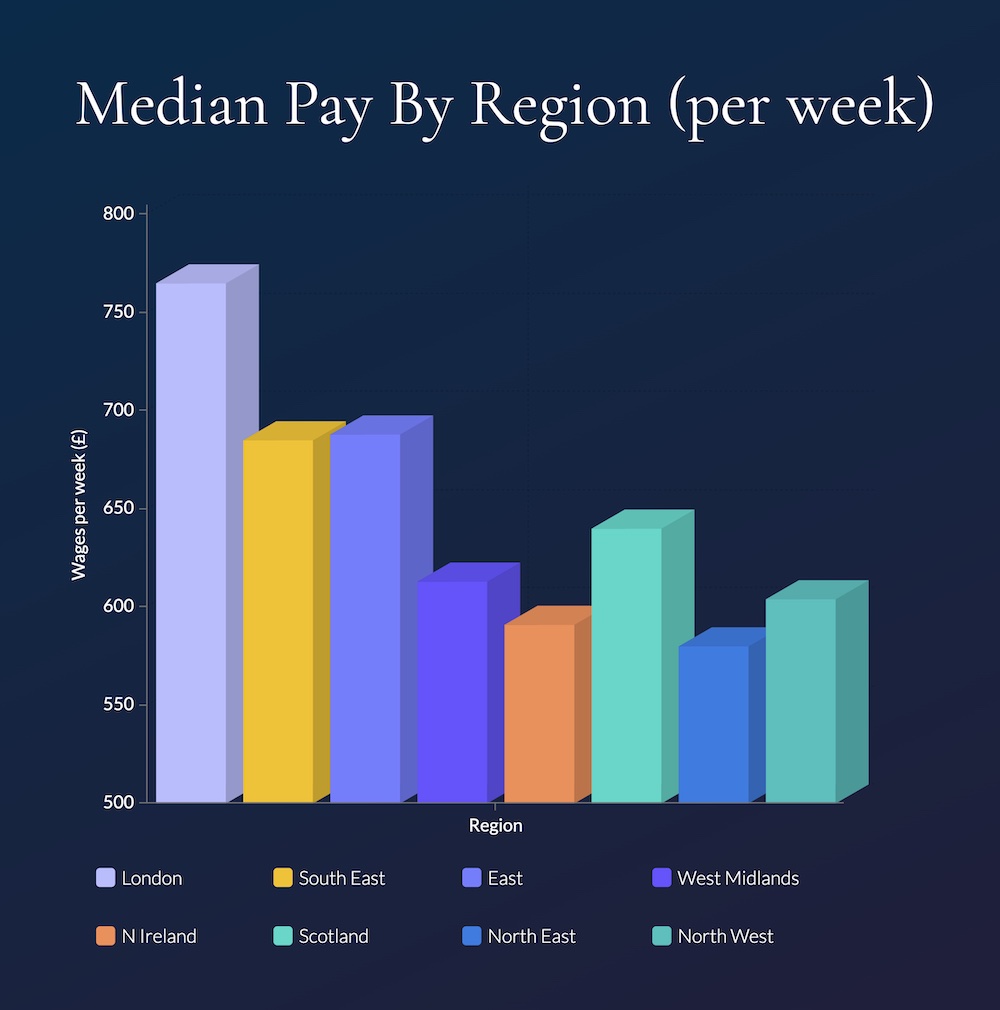
A report by the ONS, as published in the Commons Library, shows us that in 2022 London was predictably the highest earning region in the UK, with an median weekly pay of £765. London was followed by the South East and the East, with £685 and £688 respectively. A huge difference of £80 a week between London and the next highest earning region, which would equate to £4,160 a year.
Scotland comes next with £640 a week, followed by the South West (£620) and the West Midlands (£613). At the bottom of the table are Northern Ireland (£591) and the North East (£580).
At nearly £200 less a week (nearly £10,000 a year) this really does highlight the fact that wages in the country are skewed depending on where you live.
How does the average wage differ between age groups?
In the same survey, the ONS took a look at the difference between different age groups.The highest earning age group was between the ages of 40-49, where the average weekly pay was £727. The next two are either side of this age group, 50-59 (£681) and 30-39 (£678). So between the age of 30 and the age of 59, you can expect to earn the most money.
For the over 60s, they are next in the table earning £603 a week. The three lowest age groups for average earnings are the three youngest groups, with 22-29 (£546), 18-21 (£402) and 16-17 (£229). This will be influenced by the fact that there are different minimum wages for different age groups – the current rate for under 18s is £5.28 an hour.
These are all the median figures, so they won’t be skewed by a few high earners. 50% of workers will be below the figure quoted.
In which industries are wages growing the fastest?
The rate of growth in weekly earnings also differs from industry to industry. Throughout 2023, the finance and business sector has seen the largest rate of growth, currently sitting at 9% – this is the only sector in which the rate of growth in wage is higher than inflation.
Manufacturing is next with a growth rate of 7.8%, which is the highest rate of growth in the industry since the ONS began recording this data in 2001 – however it is still lower than the current rate of inflation.
Construction is next at 6.2&, followed by the public sector at 5.8% (the private sector as a whole is 7.7% by comparison), while the slowest rate of growth is in the ‘Wholesaling, retailing, hotels and restaurants’ industries, at just 5.2% – 3.5% lower than the rate of inflation.
How is the average pay in the UK calculated?
The ONS calculates the average weekly earnings using a sample of around 9,000 employers in the country, covering around 12.8 million employees. By tracking the earnings of these workers over a sustained period of time, they are to track the general trends across the country, in different sectors.
The Verdict
The average salary in the UK is around £33,000, for those that are working full time. If you are below this figure, that doesn’t mean that you are underperforming, but it could mean that things could get a bit tough if the rate of inflation continues to grow at a higher rate than your salary.
Ultimately, as we are finding out at the moment, the rate of growth in salary in the UK is not always the good news that it first seems. While an average salary can offer a comparison between you and other people in the country, it needs to be taken in the context of the economy as a whole. Even if your salary is rising, it doesn’t necessarily mean that you have more purchasing power. Wages are rising, but the true value of our wages is actually decreasing due to the rate of inflation.
The most sensible approach is to save a proportion of your wages whenever you can, to give yourself a bit of a buffer if times become a bit more difficult. Whether you are earning more than the average salary or not, it is always advisable to aim to save money for a rainy day.
Sources & Methodology:
https://www.ons.gov.uk/economy/inflationandpriceindices/timeseries/d7g7/mm23
https://commonslibrary.parliament.uk/research-briefings/cbp-8456/
The most recent available data for average earnings were used from the sources listed above. Wherever possible, we used data obtained from the ONS.
The data for the average weekly pay changes on a monthly basis when new data is released by the ONS. All information is correct at the time of publication.